Environment & editor setup
This page covers how to set up a Python environment for your research projects and how to use Spyder's tools for editing, debugging, and understanding your code.
Setting up a Conda environment
Using isolated conda environments ensures that each project has the specific dependencies it needs without conflicts. Follow the steps below to create and manage your environments.
1. Install Anaconda/Miniconda
Download and install Miniconda or Anaconda.
What's the difference?
- Miniconda is a minimal version that includes only
condaand Python, allowing you to install only the packages you need. - Anaconda comes with a full suite of pre-installed packages like
numpy,pandas,scipy, and many others, and with a GUI to manage packages and environments.
- Download the installer from the Anaconda website.
- Run the Installer: Double-click the
.exefile and follow the installation wizard. - Add Conda to PATH: During installation, check the box that says "Add Anaconda to my PATH environment variable" if you plan to use
condadirectly from the command prompt.
Warning
Adding Anaconda to PATH can sometimes cause conflicts with other software. Only do this if you are familiar with PATH management.
- Download the installer from the Anaconda website.
- Run the Installer: Open the downloaded
.pkgfile and follow the installation instructions. - Verify Installation:
-
Download the installer script from the terminal:
-
Run the Installer:
-
Follow the prompts: Accept the license terms, specify an installation path, and allow the installer to initialize
conda. -
Activate changes:
Info
Make sure to replace <version> with the correct version number of the Anaconda installer.
2. Create and manage a Conda environment
-
Create a new environment: Use the following command to create a new environment. Replace
myenvwith the name of your environment: -
Activate the environment:
-
Install packages: Install necessary packages, e.g.,
numpy,pandas, andmatplotlib: -
Export environment for reproducibility: Save your environment to a file:
This allows others to recreate your environment with:
-
Open Anaconda Navigator: Launch the Anaconda Navigator from your start menu.
-
Create a new environment:
- Go to the "Environments" tab.
- Click on "Create" and give your environment a name (e.g.,
myenv). - Select the desired Python version.
-
Install packages:
- With your environment selected, click on "Not installed" to view available packages.
- Search for the packages (e.g.,
numpy,pandas) and install them by checking the boxes and clicking "Apply".
Setting up Spyder for Python projects
Spyder is a powerful IDE for scientific programming in Python. Here's how to set it up:
1. Install Spyder
2. Create a project in Spyder
Why use Spyder projects?
Using a project allows Spyder to set the root folder for your scripts. This means that all imports and file paths are relative to this root, simplifying package management and file organization.
-
Create a New Project:
- Go to
Projects > New Projectin Spyder. - Select a directory to store your project files.
- Spyder will set this folder as the root for relative imports.
- Go to
-
Organize your project:
- Use a structure like this:
-
Activate Your Environment in Spyder:
- Go to
Tools > Preferences > Python Interpreter. - Select the interpreter from your
condaenvironment.
- Go to
Understanding your code
Spyder offers powerful tools for debugging, understanding, and navigating your code. Here's an in-depth guide on how to leverage these features, with examples to make each step clear and actionable.
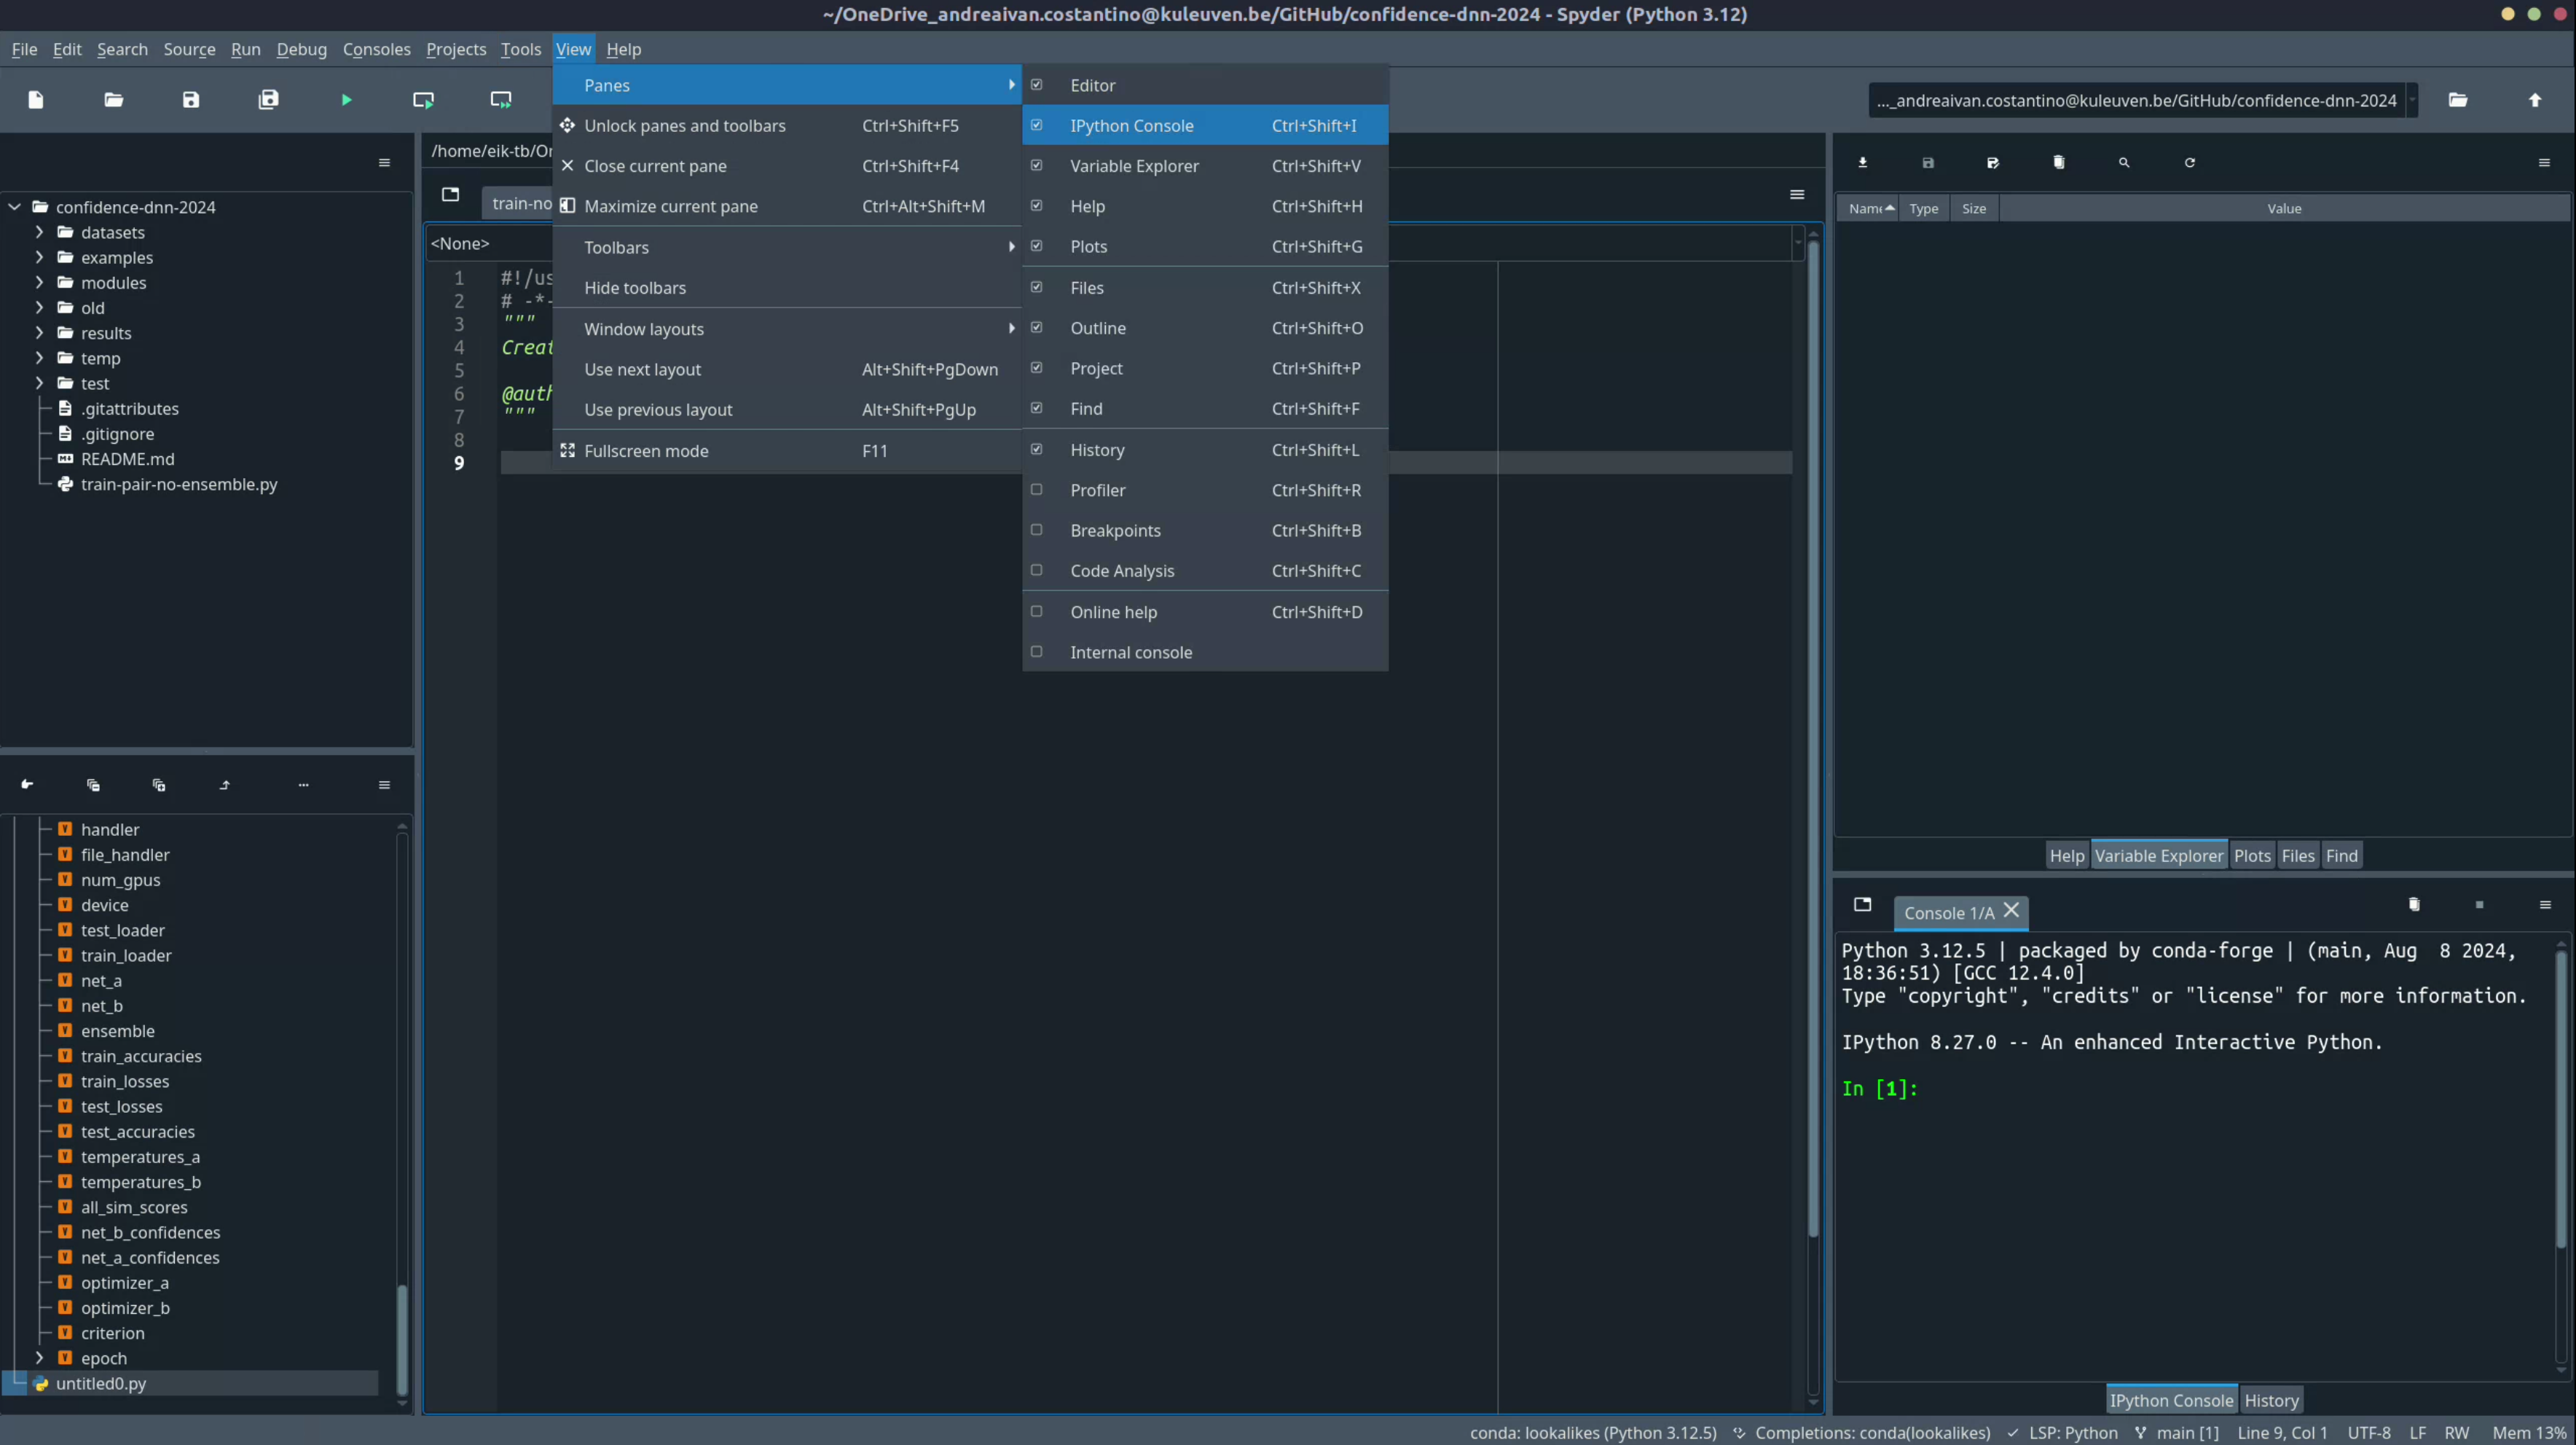
Viewing all panes in Spyder
Before diving into debugging and navigation, it's important to set up your Spyder workspace for maximum efficiency. Spyder's default layout includes several panes that provide valuable insights into your code's execution and structure.
-
Accessing the view menu:
- Go to
View > Panesto see a list of available panes. - The most useful panes include:
- Editor: This is where you write your code.
- IPython Console: Allows you to run commands interactively.
- Variable Explorer: Displays all variables in your current environment.
- Documentation: Shows documentation for selected functions and objects.
- File Explorer: Browse files and folders in your working directory.
- Go to
-
Enable recommended panes:
- Ensure that the Variable Explorer, IPython Console, Breakpoints, and Documentation panes are enabled.
- This setup will help you keep track of variables, navigate breakpoints, and access function documentation easily.
Debugging with breakpoints
Using breakpoints and Spyder's debugging tools allows you to:
- Pause code execution and inspect variables at critical points.
- Step through code line-by-line to understand how each operation transforms the data.
- Use the Variable Explorer for a visual overview of complex data structures.
- Run quick checks in the IPython console for on-the-fly validation.
These tools are crucial for identifying and fixing bugs in your scripts, whether you're working with simple calculations or more complex data processing tasks. By mastering them, you'll save time and gain deeper insights into your code's behavior.
Best practices for debugging
- Use breakpoints strategically: Place breakpoints at critical points in your code to verify data at those stages.
- Step through loops: Use "Step Over" and "Step Into" to see how data changes inside loops.
- Log important values: If you're debugging a specific issue, add print statements to log values at various points.
Step-by-step debugging walkthrough
Let's say you have a script that generates some random numbers, processes them by applying a mathematical operation, and then plots the result. You want to ensure that the numbers are correctly generated and processed before they are plotted. Here's how you can use breakpoints to achieve this:
import numpy as np
import matplotlib.pyplot as plt

# Generate random data
data = np.random.rand(100)

# Process data: apply a mathematical operation
processed_data = data * 2 + 5

# Plot data
plt.plot(processed_data)
plt.title('Processed Data')
plt.show()
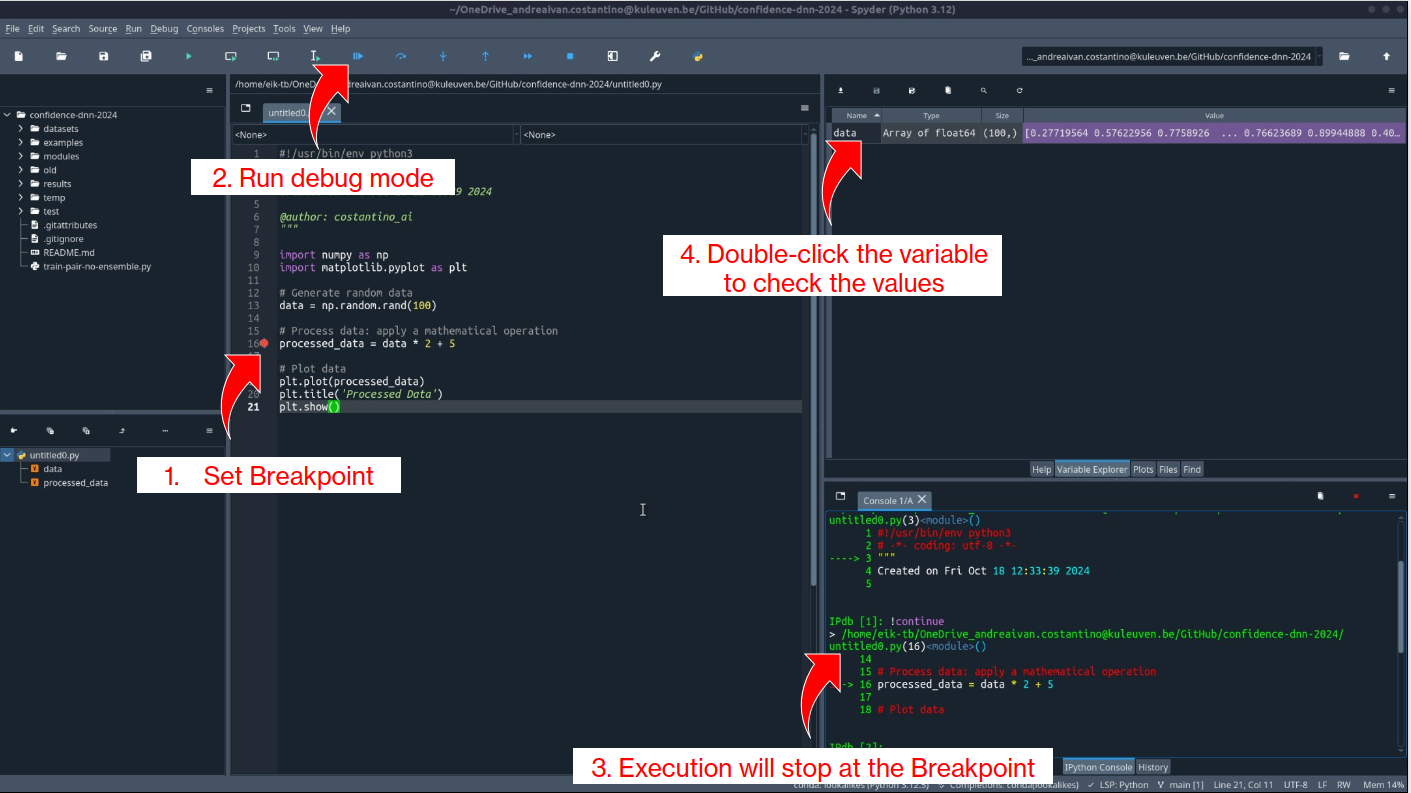
1. Adding a breakpoint
- Set a breakpoint on the line where
processed_datais calculated by clicking in the left margin next to the line or using:- Windows/Linux:
Ctrl + B - Mac:
Cmd + B
- Windows/Linux:
The line will be highlighted in red, indicating that the breakpoint is active.
Why use this?: This breakpoint allows you to pause before processed_data is calculated, so you can inspect the data values and verify that the generated numbers look as expected before the transformation is applied.
2. Running code in debug mode
Start debugging by clicking the "Debug" button in the Spyder toolbar.
- The execution will pause when it reaches the breakpoint on processed_data = data * 2 + 5.
- Once paused, you can:
- Step into a function (
Ctrl + F11): This allows you to step inside any function calls to see how they operate internally. - Step over (
Ctrl + F10): This moves to the next line without diving into the details of function calls—ideal for quickly advancing through simpler lines. - Continue (
Ctrl + F12): Resumes execution until the next breakpoint or the end of the script.
- Step into a function (
Why use this?: Step-by-step execution helps you isolate logical errors or verify how variables change through different stages, especially when debugging a transformation or complex calculation.
3. Inspecting variables during debugging
-
With the code paused at the breakpoint, use the Variable Explorer to examine the contents of
data:- Look at the array of generated numbers to ensure they are within the expected range (0 to 1 since
np.random.rand()generates random floats). - After confirming the raw
data, proceed with the next step to see howprocessed_datachanges.
- Look at the array of generated numbers to ensure they are within the expected range (0 to 1 since
-
Double-click on
datain the Variable Explorer to open a detailed view, allowing you to see the entire array and verify its values.
Why use this?: It allows you to visually inspect the contents of arrays, lists, or other data structures without needing to add print statements. This can be especially useful for quickly understanding the state of your data at different points.
4. Using the console for interactive debugging
-
While debugging, you can interact with variables directly in the IPython console to verify specific values or perform calculations without modifying the script.
-
Example: To see the first few values of
This will print the first 10 values of thedata, type:dataarray in the console, allowing you to confirm that the random numbers are as expected. -
Another Example: Check the shape of
datato ensure it has the correct number of elements:
Why use this?: This feature allows you to perform ad-hoc checks on variables or run quick tests without altering your script, which is useful for exploring potential issues during debugging.
Navigating code with "Go to definition"
Spyder makes it easy to navigate large codebases and understand how functions, classes, and variables are connected. Using features like "Go to definition," "Find references", object inspection, and the Documentation Viewer, you can explore and manage complex projects more efficiently.
Pro tips for code navigation
- Use "Go to definition" to trace complex functions: This helps you see the original implementation without scrolling through files.
- Use the Variable Explorer for quick checks: It's a faster way to spot-check variables rather than adding numerous print statements.
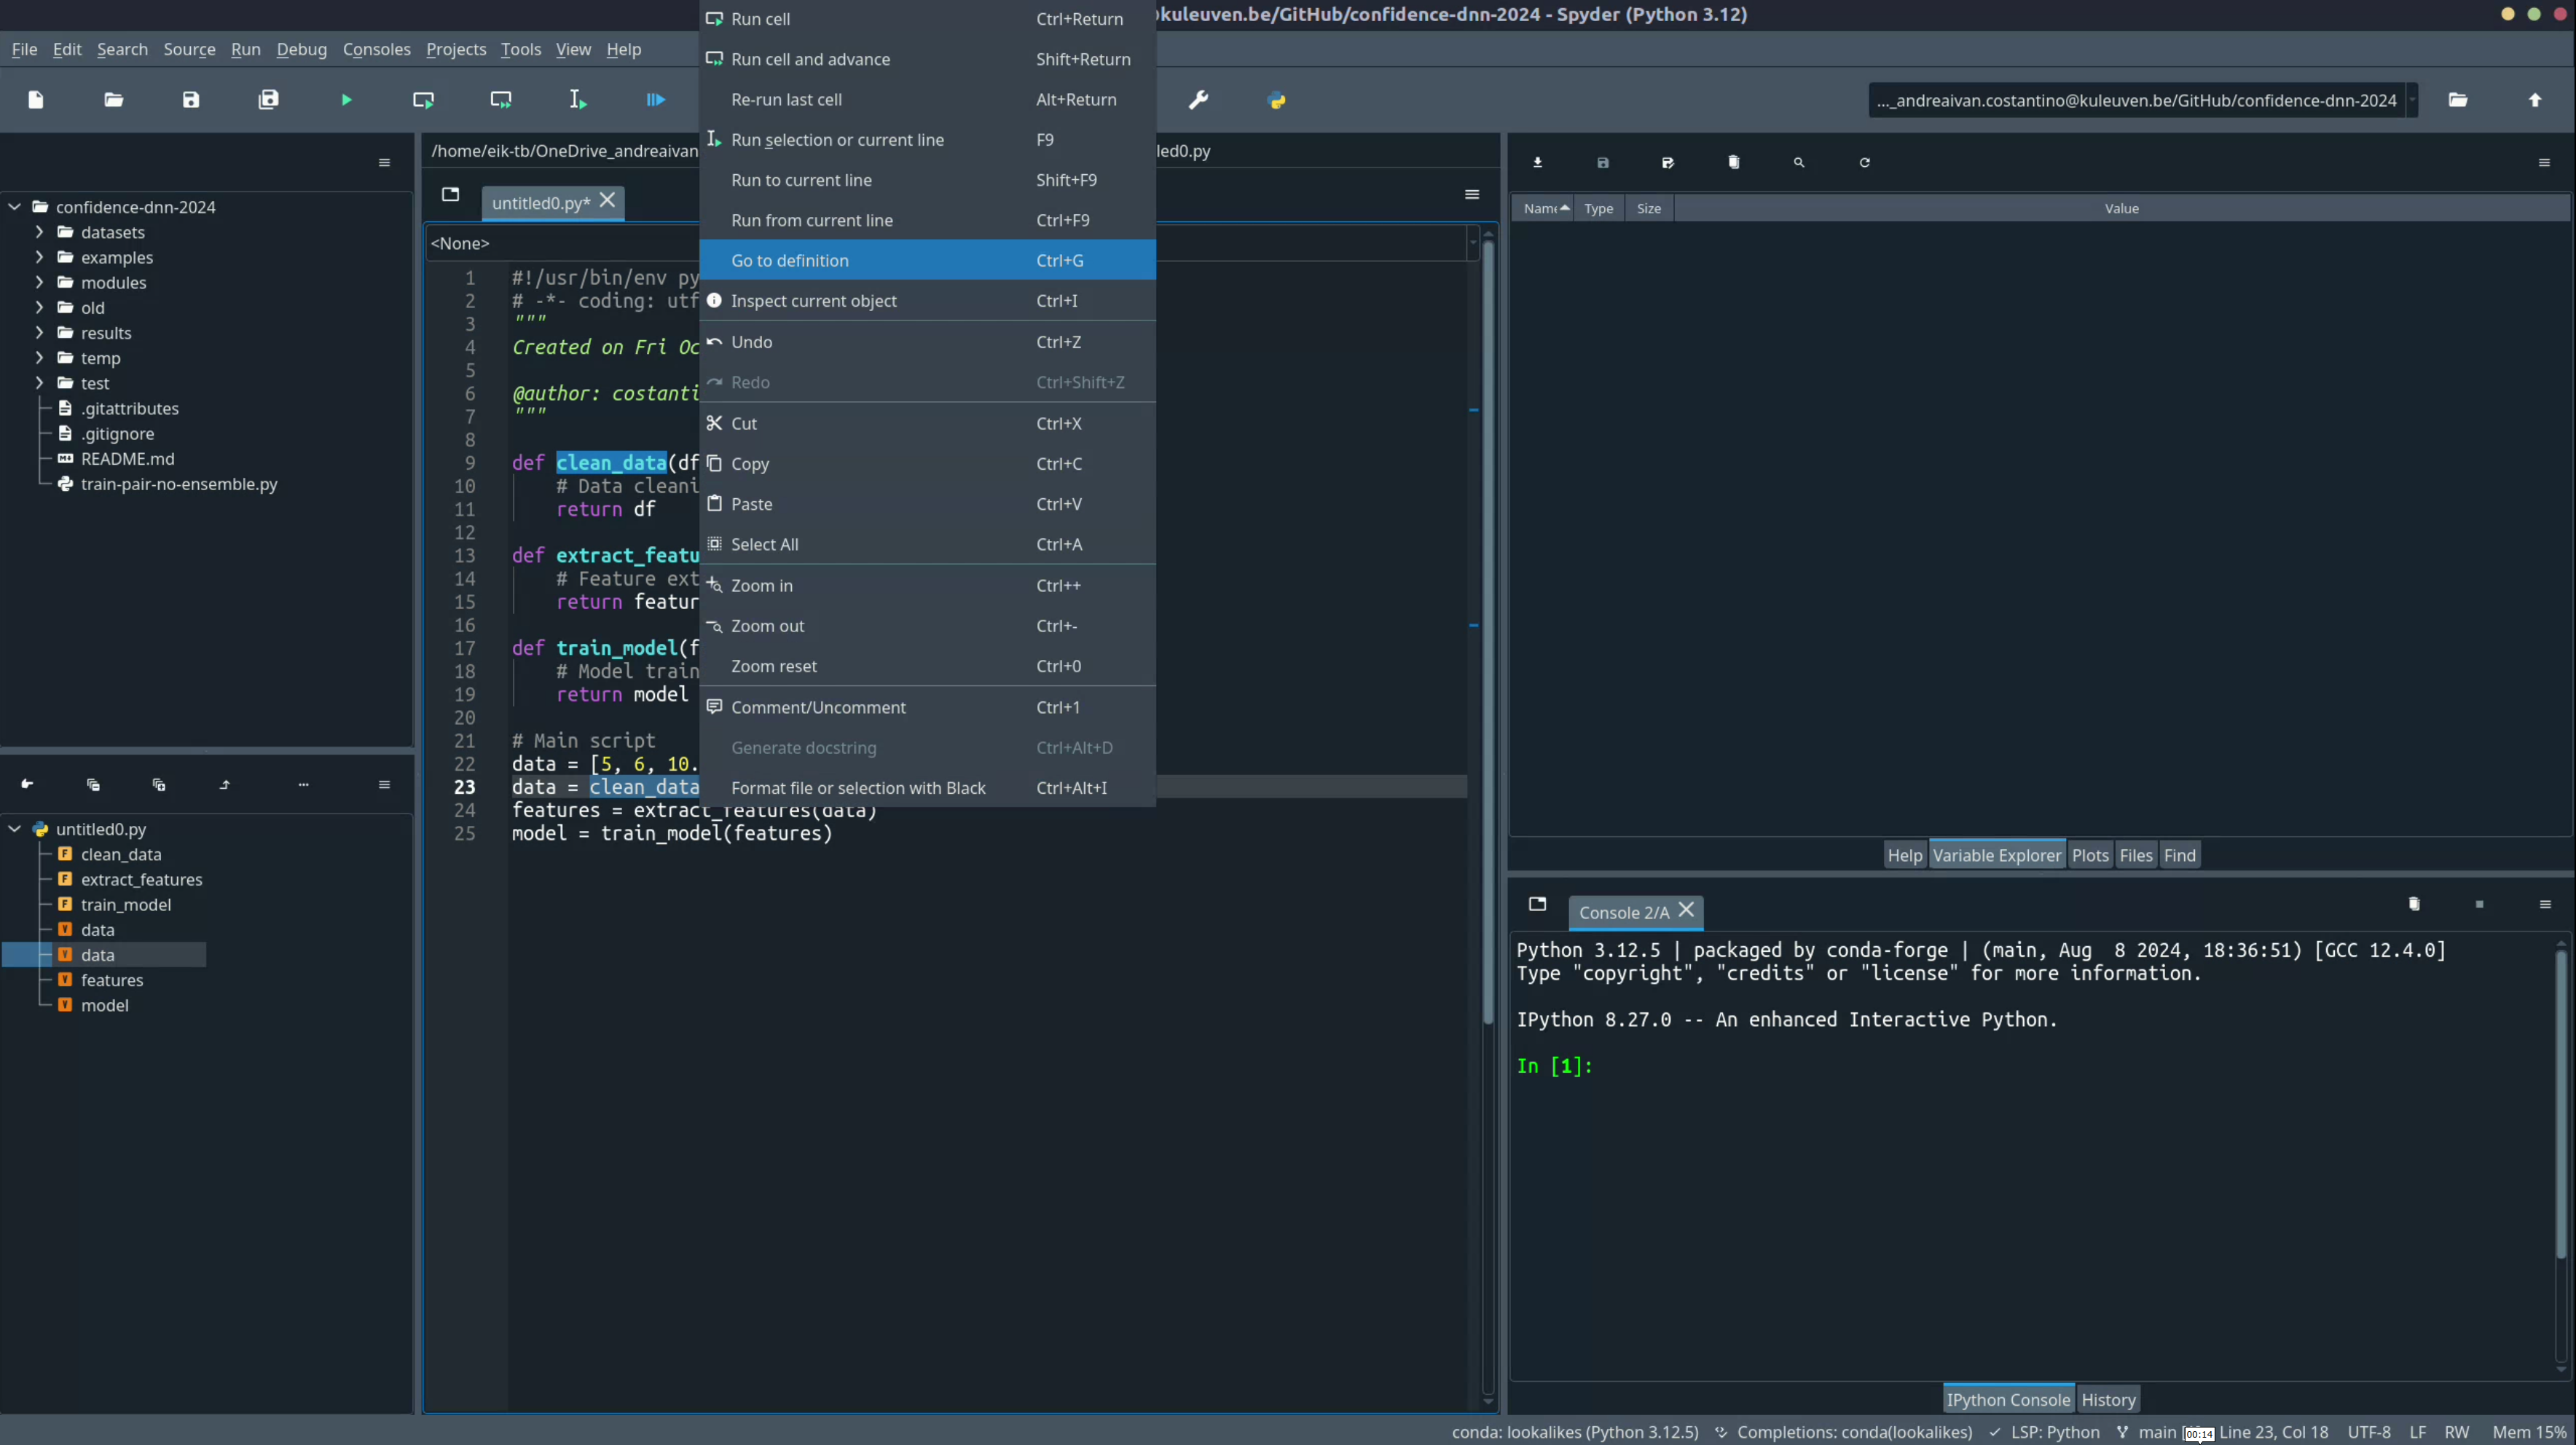
The Go to definition feature allows you to quickly jump to where a function, class, or variable is defined. This is especially useful when working with large scripts or when using functions imported from other files or libraries. Instead of scrolling through the code to find a definition, you can directly jump to it.
- How to use: Right-click on the function or class name and select "Go to Definition" or use the shortcut:
- Windows/Linux:
Ctrl + G -
Mac:
Cmd + G -
Why use this?: This feature saves time and makes it easier to understand how a function or class is implemented without losing context in your main script.
Example scenario: Navigating a machine learning pipeline
Suppose you have a script with multiple functions for data cleaning, feature extraction, model training, and evaluation. Using "Go to Definition," you can quickly jump between functions to understand the flow of your code.
def clean_data(df):
    # Data cleaning logic
    return df

def extract_features(df):
    # Feature extraction logic
    return features

def train_model(features):
    # Model training logic
    return model

# Main script
data = clean_data(data)
features = extract_features(data)
model = train_model(features)
- Scenario: You want to see the logic inside
clean_datawhile working on the main script.- Highlight and right-click on
clean_dataand select "Go to Definition." - Spyder will take you directly to where
clean_datais defined, allowing you to review the function without scrolling.
- Highlight and right-click on
Inspecting objects
Spyder's object inspection feature allows you to explore the attributes and methods of objects directly within the editor. This is particularly useful when working with unfamiliar libraries or custom classes, as it enables you to see what functions or properties are available and how to use them. This feature can be a lifesaver when you encounter a function with unclear parameters or complex behavior.
- How to use: Select an object or function in the editor and press:
- Windows/Linux:
Ctrl + I -
Mac:
Cmd + I -
Why use this?: This feature provides a quick way to understand the capabilities and usage of an object or method without needing to look up documentation online. It can save time when learning new libraries or debugging issues with complex data structures.
Example scenario: Inspecting a NumPy function
Suppose you want to generate a set of random integers using the np.random.randint function, but you're not sure about its input arguments and what it returns. You can use Spyder's object inspection to quickly get this information without leaving the IDE.
import numpy as np

# Generate random integers between 0 and 10
random_numbers = np.random.randint(0, 10, size=100)
-
Scenario: You want to know what arguments
np.random.randintaccepts and how to use it properly (e.g., what issize, and can you generate a 2D array?). -
Step 1: Select the Function: Highlight
np.random.randintin the editor. -
Step 2: Press the Shortcut: Use
Ctrl + I(Windows/Linux) orCmd + I(Mac) to bring up the documentation in the Help pane. -
What You See: The documentation for
np.random.randintappears, showing:- Input Arguments/Parameters: The range of integers (
lowandhigh),sizefor specifying the shape of the output array, and other optional parameters. - Description: An explanation of what the function does—generating random integers within a specified range.
- Returns: Information on what the function outputs (an array of integers).
- Examples: If available, code snippets showing how to use the function.
- Input Arguments/Parameters: The range of integers (
-
Why use this?: This allows you to quickly understand how to use
np.random.randintwithout having to search online. You can verify if the function supports multi-dimensional arrays by checking thesizeparameter.
Next steps
Now that your environment is set up, learn how to use version control with Git and GitHub to track changes and collaborate on your projects.